

Pimco CIO Warns of Rising US Treasury Yields – GuruFocus
On October 09, 2026, Dan Ivascyn, Chief Investment Officer at Pimco, suggested that the yield on 10-year U.S. Treasuries may rise significantly due to hedge funds and other investors selling off losing bond positions amid ongoing market turmoil. This situation has implications for various sectors, including technology and hardware, where companies like Super Micro Computer Inc SMCI operate. Here are some key points to consider:
The recent commentary from Ivascyn highlights a broader concern in the financial markets, where rising Treasury yields could pressure various asset classes, including equities. The potential for increased yields stems from technical trading indicators and stop-loss actions by leveraged investors, which could lead to further sell-offs in the bond market. This environment may compel investors to reassess their portfolios, particularly in sectors like commercial real estate, which Ivascyn described as having a fragile capital structure.
Super Micro Computer Inc, known as Supermicro, operates within the technology sector, specifically in hardware solutions. With a market capitalization of approximately $28.1 billion, the company specializes in high-performance server and storage solutions, catering primarily to data center operators and cloud service providers. The company’s innovative approach, focusing on modular architecture, positions it well in the growing AI and cloud computing markets.
When evaluating SMCI’s valuation, the Price-to-Sales (P/S) ratio is a critical metric. Currently, SMCI’s P/S ratio stands at approximately 0.56, which is significantly below its historical median. This suggests that the market is pricing the company at a discount relative to its historical performance and industry peers. Given that SMCI is currently unprofitable and cash-flow-negative, traditional earnings-based metrics like P/E are not applicable for valuation purposes. Instead, the low P/S ratio indicates that the market may be factoring in challenges ahead for the company.
While the GF Value™ for SMCI is calculated at $89.09, indicating that the stock is 52.0% undervalued compared to its current price of $42.77, this figure should be viewed as a directional warning rather than a precise target. The inherent volatility and cash-flow challenges make it difficult to rely solely on GF Value™ in this context. For more information, visit GF Value™.
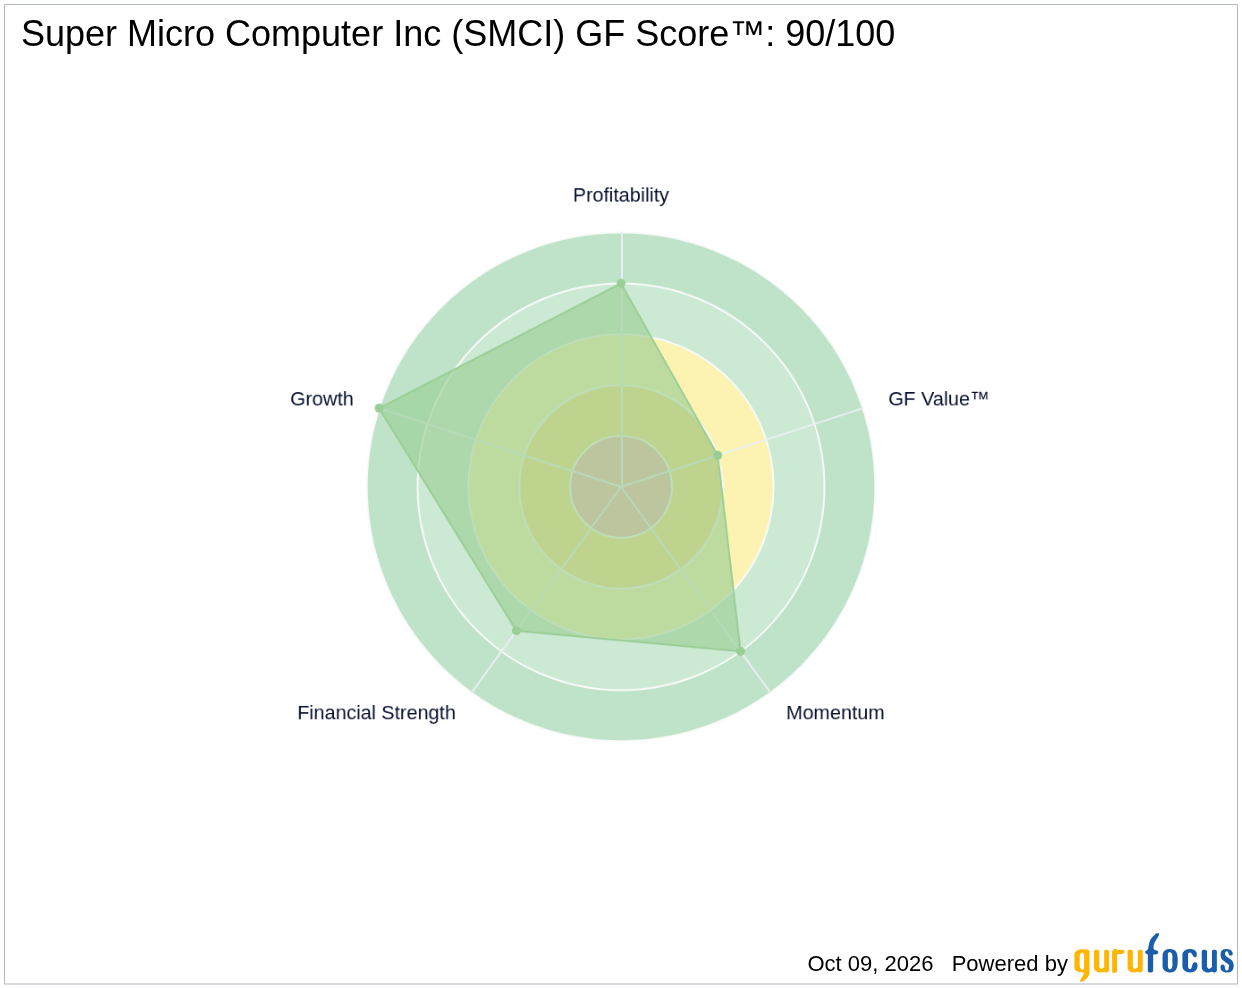
The GF Score™ is a comprehensive measure that evaluates a company’s financial strength, profitability, growth potential, valuation, and momentum. SMCI’s impressive GF Score™ of 90 reflects strong performance, particularly in growth, where it ranks 10/10. However, its valuation rank is concerning at 4/10, indicating potential overvaluation risks. Below is a summary of SMCI’s GF Score™ metrics:
SMCI’s strengths lie in its growth potential and profitability, which are crucial in the technology sector. However, the low valuation rank raises concerns about whether the stock is being accurately priced in the current market environment. For a deeper dive into SMCI’s performance, visit the SMCI stock page.
Currently, 8 gurus hold positions in SMCI, with 7 adding to their stakes and 2 trimming their holdings in recent quarters. This indicates a generally positive sentiment among institutional investors. However, the insider selling of $15.4 million over the past three months raises questions about the confidence of those closest to the company in its future performance.

In summary, while SMCI exhibits strong growth potential and a high GF Score™, its low Price-to-Sales ratio and recent insider selling signal caution for investors. The valuation metrics suggest that while the stock may appear undervalued based on GF Value™, the inherent risks associated with its cash-flow-negative status warrant careful consideration. For ongoing updates and detailed analysis, check out the SMCI stock page.
What is SMCI’s GF Score™?
SMCI has a GF Score™ of 90, indicating strong overall performance across various financial metrics.
Is SMCI overvalued or undervalued?
SMCI’s Price-to-Sales ratio suggests it is undervalued, but traditional P/E metrics are not meaningful due to the company’s cash-flow-negative status.
What is SMCI’s P/E ratio compared to historical?
SMCI’s current P/E (TTM) is 13.01, significantly lower than its 5-year median of 19.39, reflecting its current unprofitability.
This stock alert was generated using automated technology and GuruFocus financial data to provide readers with timely and accurate market reporting. This content was reviewed by GuruFocus editorial team prior to publication. Please send any questions or comments about this story to [email protected].
We’d love to learn more about your experiences on GuruFocus.com and how we can improve!
source
This article was autogenerated from a news feed from CDO TIMES selected high quality news and research sources. There was no editorial review conducted beyond that by CDO TIMES staff. Need help with any of the topics in our articles? Schedule your free CDO TIMES Tech Navigator call today to stay ahead of the curve and gain insider advantages to propel your business!
The recent commentary from Ivascyn highlights a broader concern in the financial markets, where rising Treasury yields could pressure various asset classes, including equities. The potential for increased yields stems from technical trading indicators and stop-loss actions by leveraged investors, which could lead to further sell-offs in the bond market. This environment may compel investors to reassess their portfolios, particularly in sectors like commercial real estate, which Ivascyn described as having a fragile capital structure.
Super Micro Computer Inc, known as Supermicro, operates within the technology sector, specifically in hardware solutions. With a market capitalization of approximately $28.1 billion, the company specializes in high-performance server and storage solutions, catering primarily to data center operators and cloud service providers. The company’s innovative approach, focusing on modular architecture, positions it well in the growing AI and cloud computing markets.
When evaluating SMCI’s valuation, the Price-to-Sales (P/S) ratio is a critical metric. Currently, SMCI’s P/S ratio stands at approximately 0.56, which is significantly below its historical median. This suggests that the market is pricing the company at a discount relative to its historical performance and industry peers. Given that SMCI is currently unprofitable and cash-flow-negative, traditional earnings-based metrics like P/E are not applicable for valuation purposes. Instead, the low P/S ratio indicates that the market may be factoring in challenges ahead for the company.
While the GF Value™ for SMCI is calculated at $89.09, indicating that the stock is 52.0% undervalued compared to its current price of $42.77, this figure should be viewed as a directional warning rather than a precise target. The inherent volatility and cash-flow challenges make it difficult to rely solely on GF Value™ in this context. For more information, visit GF Value™.
The GF Score™ is a comprehensive measure that evaluates a company’s financial strength, profitability, growth potential, valuation, and momentum. SMCI’s impressive GF Score™ of 90 reflects strong performance, particularly in growth, where it ranks 10/10. However, its valuation rank is concerning at 4/10, indicating potential overvaluation risks. Below is a summary of SMCI’s GF Score™ metrics:
SMCI’s strengths lie in its growth potential and profitability, which are crucial in the technology sector. However, the low valuation rank raises concerns about whether the stock is being accurately priced in the current market environment. For a deeper dive into SMCI’s performance, visit the SMCI stock page.
Currently, 8 gurus hold positions in SMCI, with 7 adding to their stakes and 2 trimming their holdings in recent quarters. This indicates a generally positive sentiment among institutional investors. However, the insider selling of $15.4 million over the past three months raises questions about the confidence of those closest to the company in its future performance.
In summary, while SMCI exhibits strong growth potential and a high GF Score™, its low Price-to-Sales ratio and recent insider selling signal caution for investors. The valuation metrics suggest that while the stock may appear undervalued based on GF Value™, the inherent risks associated with its cash-flow-negative status warrant careful consideration. For ongoing updates and detailed analysis, check out the SMCI stock page.
What is SMCI’s GF Score™?
SMCI has a GF Score™ of 90, indicating strong overall performance across various financial metrics.
Is SMCI overvalued or undervalued?
SMCI’s Price-to-Sales ratio suggests it is undervalued, but traditional P/E metrics are not meaningful due to the company’s cash-flow-negative status.
What is SMCI’s P/E ratio compared to historical?
SMCI’s current P/E (TTM) is 13.01, significantly lower than its 5-year median of 19.39, reflecting its current unprofitability.
This stock alert was generated using automated technology and GuruFocus financial data to provide readers with timely and accurate market reporting. This content was reviewed by GuruFocus editorial team prior to publication. Please send any questions or comments about this story to [email protected].
We’d love to learn more about your experiences on GuruFocus.com and how we can improve!
source
This article was autogenerated from a news feed from CDO TIMES selected high quality news and research sources. There was no editorial review conducted beyond that by CDO TIMES staff. Need help with any of the topics in our articles? Schedule your free CDO TIMES Tech Navigator call today to stay ahead of the curve and gain insider advantages to propel your business!


